First-Order Reversal Curves (FORCs) Scientific article By Dr.Mohammed Hashim
12/03/2022 Share :
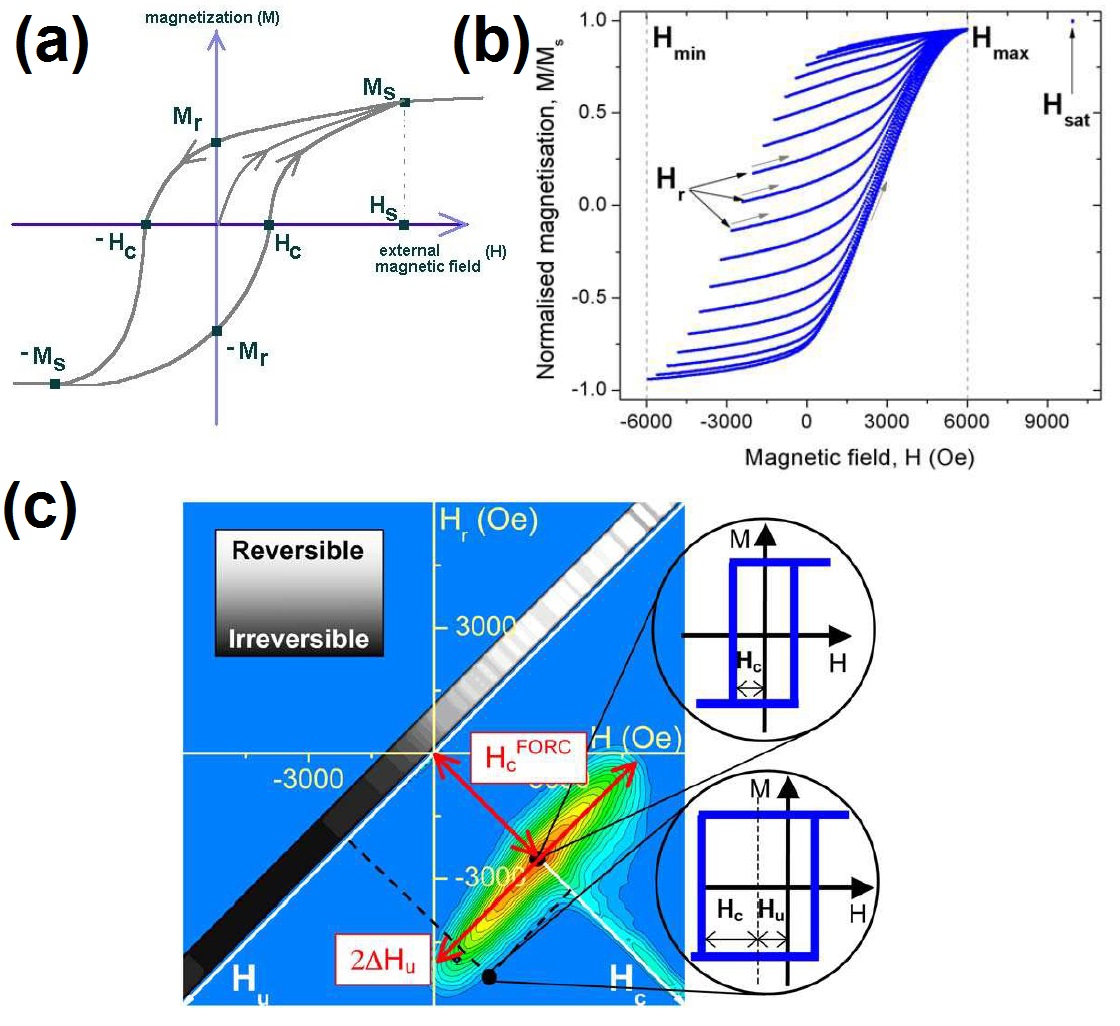
The most common analysis used to exam and characterize the magnetic properties of materials is the hysteresis loop measurement (M-H curve). The parameters extracted from the hysteresis curve figure 1 (a), that are used to characterize the magnetic properties of magnetic materials include: the saturation magnetization Ms (the magnetization at maximum external field), the remanence Mr (the magnetization at zero external field after remove applied field), and the coercivity Hc (the external field that required to demagnetize the sample) [1].<br />While major hysteresis curves give information only about average behavior of magnetic systems, first-order-reversal-curves (FORCs) is a powerful tool in the study of magnetic materials properties and more complex and unique magnetization curves located inside the major hysteresis loop. FORCs can give additional information about magnetic materials such as: magnetic interaction distribution Hu, coercivity field distribution Hc, FORC can distinguish between single-domain (SD), multi- domain (MD), and pseudo single-domain (PSD) behavior. It has also been used to distinguish between phases in multiphase magnetic materials [1].<br />The goal of FORC measurements is to retrieve the Hc and Hu parameters of each mathematical hysteron in the system. To this end, to measure the FORCs, the system is first positively saturated in order to put all the hysteron magnetization in the “up” position. The input variable (i.e., the external applied field H) is then lowered to a reversal field (Hr), which switches “down” the magnetization of some hysteron, depending on their Hc and Hu parameters. Afterward, the field H is increased again and the magnetization M is measured. The difference of magnetization between the applied field and the reversal field is directly proportional to the amount of hysteron that switched back “up”. This kind of minor hysteresis curve is called first-order reversal curve. The information about all hysterons in the system, the FORC distribution ρFORC, can be obtained by generalizing the process, i.e. applying a second-order mixed derivative of M on a set of FORCs beginning at different Hr, according to Figure 1 (b) [2]:<br />FORC diagram” as shown in Figure 1 (c) [3]. It consists of a contour plot of the FORC distribution (ρFORC), with a scale going from blue (minimum ρFORC) to red (maximum ρFORC), which directly indicates the statistical distribution of the mathematical hysterons. In order to read the Hc and Hu mathematical hysteron parameters directly from the diagram, it is convenient to execute a change of coordinates, thereby defining a coercive field axis Hc and an interaction field axis Hu as follows: H_c=(H-H_r)/2,H_u=-(H+H_r)/2 , the Hc and Hu cross-sections in the classical Preisach model approach directly yield the coercivity and interaction field distributions.<br />Figure 1: (a) (M-H) hysteresis loop[4], (b) Set of experimental FORCs [5]. (c) FORC diagram (calculated from the set of FORCs shown in Figure (1 -b ))[3].<br />References<br />[1] B. Dodrill, Magnetometry and First-Order-Reversal-Curve (FORC) Studies of Nanomagnetic Materials, in, Dekker Encyclopedia of Nanoscience and Nanotechnology, Taylor & Francis, 2016.<br />[2] I. Mayergoyz, Hysteresis models from the mathematical and control theory points of view, J Journal of Applied Physics, 57, 3803-3805 (1985).<br />[3] F. Béron, Propriétés magnétostatiques de réseaux de nanofils via les courbes de renversement du premier ordre, Book, 2009.<br />[4] S. Aktas, Gas phase preparation of magnetic nanoparticle hydrosols, in, University of Leicester, 2014.<br />[5] F. Béron, L.-P. Carignan, D. Ménard, A. Yelon, Extracting individual properties from global behaviour: first-order reversal curve method applied to magnetic nanowire arrays, in: Electrodeposited Nanowires and Their Applications, IntechOpen, 2010.<br /><br />