Scientific Article by Lecturer Dr. Najah Rasheed about Big Data
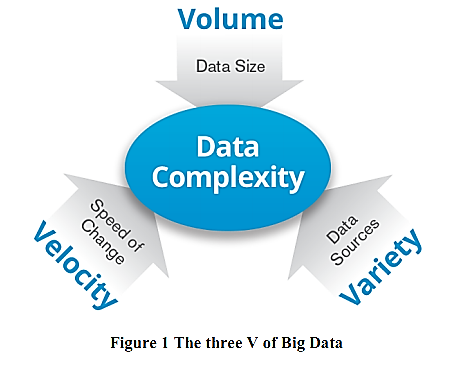
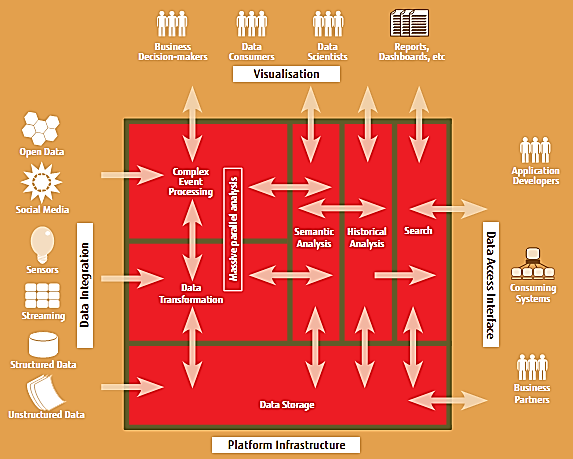
Big data:<br />Today, many organizations are collecting, storing, and analyzing massive amounts of data. This data is commonly referred to as “big data” because of its volume, the velocity with which it arrives, and the variety of forms it takes. Big data is creating a new generation of decision support data management.<br />Big data refers to the large, diverse sets of information that grow at increasing rates. It encompasses the volume of information, the velocity or speed at which it is created and collected, and the variety or scope of the data points being covered. Big data often comes from multiple sources and arrives in multiple formats. The three V: Volume, Velocity and Variety as shown in Figure 1.<br /><br /> Volume: Large amounts of data, from datasets with sizes of terabytes to zettabyte. <br /> Velocity: Large amounts of data from transactions with high refresh rate resulting in data streams coming at great speed and the time to act on the basis of these data streams will often be very short. There is a shift from batch processing to real time streaming. <br />Variety: Data come from different data sources. For the first, data can come from both internal and external data source. More importantly, data can come in various formats such as transaction and log data from various applications, structured data as database table, semi-structured data such as XML data, unstructured data such as text, images, video streams, audio statement, and more. There is a shift from sole structured data to increasingly more unstructured data or the combination of the two.<br /><br />Organizations nowadays are capturing additional data from its operational environment at an increasingly fast speed. Some examples are listed here. <br /> Web data. Customer level web behaviour data such as page views, searches, reading reviews, purchasing, can be captured.<br /> Text data (email, news, Facebook feeds, documents, etc).<br /> Time and location data. GPS and mobile phone as well as Wi-Fi connection makes time and location information a growing source of data.<br /> Smart grid and sensor data.<br /> Social network data. Within social network sites like Facebook, , Instagram, it is possible to do link analysis to uncover the network of a given user.<br />The diagram below gives a simple breakdown of how such a solution can be structured. The red box represents the solution itself. Outside on the left-hand side, are the various data sources that feed into the system. This data can then be transformed via the ‘data transformation’ function. The data can then be processed and analysed in near real time. Finally, data visualization presenting information to business users in a form that is meaningful, relevant and easily understood.<br />